Evaluation of physical development by centile tables. Mandatory anthropometric data for assessing physical development
Every child is different - it's not a secret. However, there are indicators that children in certain age groups must meet the average statistical standards. Such parameters help the doctor to determine the possible presence of problems from the physical and mental development, and also to assume the presence of any disease.
Evaluation of the child's physical development is a very important point for any doctor and, of course, for parents. What do all these scales, scores and tables mean in the life of the baby and where do they come from?
Newborn
When a child is born, he immediately gets his first evaluation. On the Apgar scale, the neonatologist places a certain number of points in the first and fifth minutes of the baby's life. From these two figures depends whether he will stay with his mother or he needs additional medical help, the question of the first vaccinations is being decided.
Babe up to the year
After the baby turns one month old, the mother must carry the baby to the scheduled receptions to the pediatrician. This happens on schedule, when the baby is executed:
- one month;
- three months;
- six months;
- nine months;
- twelve months.
At these receptions, the evaluation of physical development on centile tables is compulsorily carried out. They also record the age when the child began to smile, first sat down, got up, took the first steps, said the first word, the timing of teething. Measure:
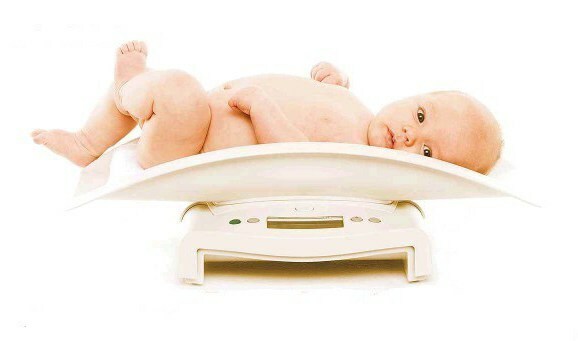
- Weight.
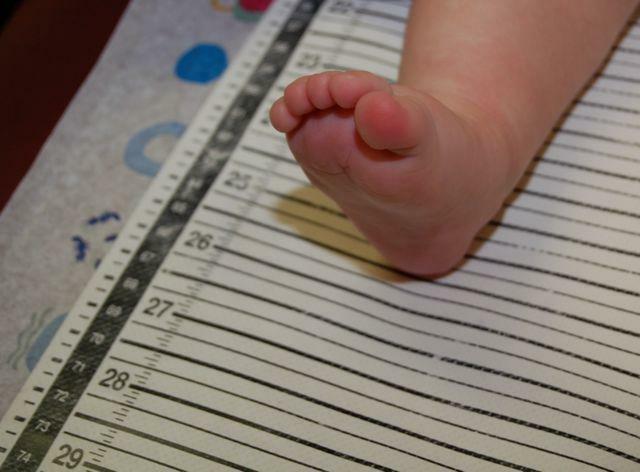
- Body length.
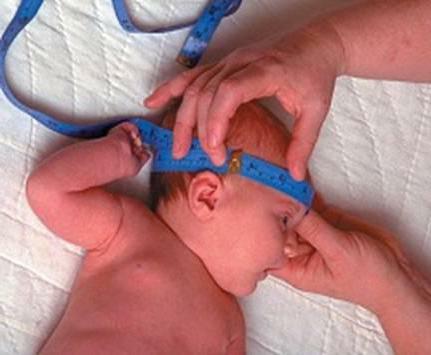
- Volume / circumference of the head.
- The size of the chest.
- Body temperature.
- The fontanel size.
Based on these data and possible complaints from the mother, the child can be sent for additional tests or specialist intake. In other cases, an evaluation of physical development is made for the centile tables. The norm of development according to these tables is always considered to be in the middle corridors, that is, in the range of 25-75 percent. But the child can also develop quite normally, if the data for all indicators are in the same range, lower or higher than the average( in this case they speak about the features of the build).
Centenary tables for boys up to the year
To measure the growth of a baby for up to a year, a special board with bumps is used in the clinic. One of them is pressed the head of the child, the other - the legs.
| Age of the boy | Height of the boy | ||||||
| Centval interval,% | |||||||
| 3-9 | 10-24 | 25-49 | 50-74 | 75-89 | 90-96 | 97-100 | |
| newborn | 46, 5 | 48 | 49, 8 | 51, 3 | 52, 5 | 53, 5 | 55 |
| 1 | 49, 5 | 51, 5 | 52, 7 | 54, 5 | 55, 5 | 56, 5 | 57, 5 |
| 3 | 55, 5 | 57, 5, 5 | 58, 1 | 60 | 61 | 62 | 64 |
| 6 | 61, 5 | 63 | 65 | 66 | 68 | 69 | 71, 5 |
| 9 | 67, 5 | 68, 2 | 70 | 71, 5 | 73, 2 | 75 | 79 |
| 12 | 71 | 72, 5 | 74 | 75, 5 | 77, 3 | 80 | 82 |
The centenary tables for boys and girls alsocontain data on the size of the child's head. Inconsistency with the standards for this parameter is the reason to send the baby to a neurologist.
| Age of the | Head circumference of the boy | ||||||
| Cential interval,% | |||||||
| 3-9 | 10-24 | 25-49 | 50-74 | 75-89 | 90-96 | 97-100 | |
| newborn | 33 | 34 | 34-35 | 35 | 35-37 | 37 | 37, 5 |
| 1 | 34, 5 | 35, 5 | 36, 5 | 37 | 38 | 39 | 40, 5 |
| 3 | 38 | 39 | 40 | 40, 5 | 41, 5 | 42, 5 | 43, 5 |
| 6 | 41, 5 | 42 | 43 | 44 | 45 | 45, 5 | 46, 5 |
| 9 | 43, 5 | 44 | 45 | 46 | 46, 5 | 47, 5 | 48 |
| 12 | 44, 5 | 45, 5 | 46 | 47 | 48 | 48, 5 | 49, 5 |
Factors affecting the physical development of
The physical health of a child is the main indicator of his health. It depends on several factors:
- climatic conditions;
- heredity;
- power supply;
- the level of material well-being of the family;
- compliance with the daily routine;
- parent-child relationship;
- psychological atmosphere in the family.

Mandatory anthropometric data for assessing the physical development of children after the year
The evaluation of the physical development of children after the year occurs according to the following indicators:
- Somatic parameters( weight in kg, height in cm, chest circumference in cm).
- Somatoscopic indices( skin, mucous membranes, development of subcutaneous fat deposits, development of the musculoskeletal system, level of sexual development).
- Physiometric parameters( muscle strength, lung capacity, blood pressure, heart rate).
- General health status( past illnesses, presence of chronic ailments).
Methods for assessing physical development are strictly unified, because only by conducting measurements under the same conditions and with the same tools can we talk about the comparability and reliability of the results of the study.
Somatic indicators of
Evaluation of the child's physical development often occurs in this way: the somatic indices of the development of a particular child are compared with the centile tables according to age and sex. How do these tables look for boys, can be considered below.
| Age of the | Growth of the boy | ||||||
| The interval interval,% | |||||||
| 3-9 | 10-24 | 25-49 | 50-74 | 75-89 | 90-96 | 97-100 | |
| 2 years | 81 | 83 | 84, 5 | 87 | 89 | 100 | 94 |
| 3 years | 88 | 90 | 92, 5 | 96 | 100 | 102 | 104, 5 |
| 5 years | 99 | 101, 5 | 104, 5 | 108, 5 | 112 | 114, 5 | 117 |
| 7 years | 111 | 113, 5 | 117 | 121 | 125 | 128 | 130, 5 |
| 10 years | 126, 5 | 129, 5 | 133 | 138 | 142 | 147 | 149 |
For girls, growth rates are slightly different. Up to two years they are usually slightly smaller than boys, but after catching up and even ahead in growth.
| Age of the | Height of the girl | ||||||
| The interval interval,% | |||||||
| 3-9 | 10-24 | 25-49 | 50-74 | 75-89 | 90-96 | 97-100 | |
| 2 years | 80 | 82 | 83, 5 | 85 | 87,5 | 90 | 92, 5 |
| 3 years | 89 | 91 | 93 | 95, 5 | 98 | 100, 5 | 103 |
| 5 years | 100 | 102, 5 | 105 | 107, 5 | 111 | 113, 5 | 117 |
| 7 years | 111 | 113, 5 | 117 | 121 | 125 | 128 | 131, 5 |
| 10 years | 127 | 130, 5 | 134, 5 | 19 | 143 | 147 | 151 |
Study of somatoscopic indices
Methods for assessing physical development include a number of basic measurement indicators. They can be studied in the following table.
| Characteristics of Parameters of Norm Note Fatigue Thickness of fat fold on abdomen 1-2 cm Side at navel level and under scapula Shape and features of chest development Cylindrical, flat, conical, mixed, rickety, barrel-shaped Cylindrical Sometimes in young children, a chest of mixed type can be considered as the norm. Backbone of Slim, chunky, intermediate - - Spine Normal, kyfotilordotic Normal - s-shaped in the sagittal plane Scoliosis also includes scoliosis Foot shape Vaulted, flat, flat Vaulted( normal) - Evaluation of the physical development of schoolchildren occurs including withby measuring the body's functional parameters: 1. The vital capacity( volume) of the lungs is an indicator of the strength of the respiratory muscles and lung volume. The measurement is performed using an air spirometer or a water spirometer. Age indicators for children of different sex and age will differ. Age Gender Girls Boys Volume, ml Strength Volume, ml Strength 8 years 1474 280 1670 301 10 years 1903 360 2000 409 15 years 3022 433 3670 729 2. The strength of the muscles of the hands is the degree of development of the muscles. The measurement is carried out by an instrument called a manual dynamometer. Age, years Number of beats per minute 1 120-125 3 105-110 5 93-100 7 85-90 10 78-85 15 70-76 5. Blood pressure is measured after seven years. Normally, from this age, the systolic( upper) should be within 100-120 mm Hg.st., and diastolic( lower) - 60-80 mm Hg. Art. The evaluation of physical development by these indicators is made by comparing the individual indicators and the average values characteristic for a given age and sex group of children. Mandatory anthropometric data for assessing physical development are used in other methods: All the methods considered above take into account only the morphological data of the development evaluation, but for a growing person it is natural and necessary to take into account biological development. The integrated method includes: Integrated assessment of physical development, which is carried out in medical and preventive treatment establishments, as well as during detailed medical examinations, allows children to be divided into five different health groups depending on the data set: The evaluation of the physical development of adolescents does not differ from the assessment methods used for all children. All tables and scales include data for children under 17 years old. Although, of course, we must not forget that the development of girls after nine years and boys after eleven will be significantly different from the development of younger children. In adolescence, there are significant changes in the proportions of the body and the development of organs and systems: It should be noted that the accelerating rates of physical development( acceleration) have significantly changed the norms of somatic indicators lately. |

 This method is sufficiently developed, but has the same drawback as the method of anthropometric standards. Therefore, the evaluation of physical development will be more accurate if we use two-dimensional centile tables, which take into account the dependence of body length on mass.